Actionable Information – Research Briefs – 6 – Estimation of excess mortality associated with COVID-19 for Mexico and the U.S.
Suggested citation:
Gonzalez-Farias, G., Marquez-Urbina, J., Castillo-Casanova, R., Pineda-Antunez, C., Medina-Cetina, Z., Pompelli, G., Cochran, M., Olivares, M. & Perez-Patron, M (2021). Actionable Information – Research Briefs – 6 – Estimation of excess mortality associated with COVID-19 for Mexico and the U.S. https://r13-cbts-sgl.engr.tamu.edu/actionable-information-research-briefs-6-estimation-of-excess-mortality-associated-with-covid-19-for-mexico-and-the-u-s/
@misc{Gonzalez2021,
   author = {Gonzalez-Farias,Graciela and Marquez-Urbina, Jose Ulises and Castillo-Casanova, Roman and Pineda-Antunez, Carlos and Medina-Cetina, Zenon and Pompelli, Gregory and Cochran, Matt and Olivares, Miriam and Perez-Patron, Maria Jose},
   title = {Actionable Information - Research Briefs - 6 - Estimation of excess mortality associated with COVID-19 for Mexico and the U.S.},
   url={https://r13-cbts-sgl.engr.tamu.edu/actionable-information-research-briefs-6-estimation-of-excess-mortality-associated-with-covid-19-for-mexico-and-the-u-s/},
   year={2021},
   month={May}
}
Objective: Compare the total deaths per week during the 2020 pandemic against the expected deaths according to the reported in the previous four years.
Methodology: The excess mortality is defined as the difference between the observed and the expected deaths in a period. Two techniques are employed to compute the excess mortality: Farrington’s method (Farrington et al., 1996) and the endemic channel procedure (Boletín Estadístico Sobre Exceso Mortalidad Por Todas Las Causas Durante La Emergencia Por COVID-19. Gobierno de México, 2021). In Farrington’s method, the expected deaths are given by the upper limit of a 95% prediction interval for the mean of a quasi-Poisson regression with a linear time trend and a seasonal factor for the weekly death count data. In the endemic channel method, the expected deaths correspond to the 90% percentile of the weekly historical mortality data. Both methods are adjusted from all-cause mortality data of the years 2015-2019. The United States Centers for Disease Control and Prevention (CDC) utilizes Farrington’s method, while the Mexican government uses the endemic channel procedure.
Results: Farrington’s method indicates that in 2020 Mexico and the U.S. exceeded the number of expected deaths by 20% and 12%, respectively. The Endemic Channel method indicates that Mexico exceeded the expected deaths by 39%, while the U.S. by 17%
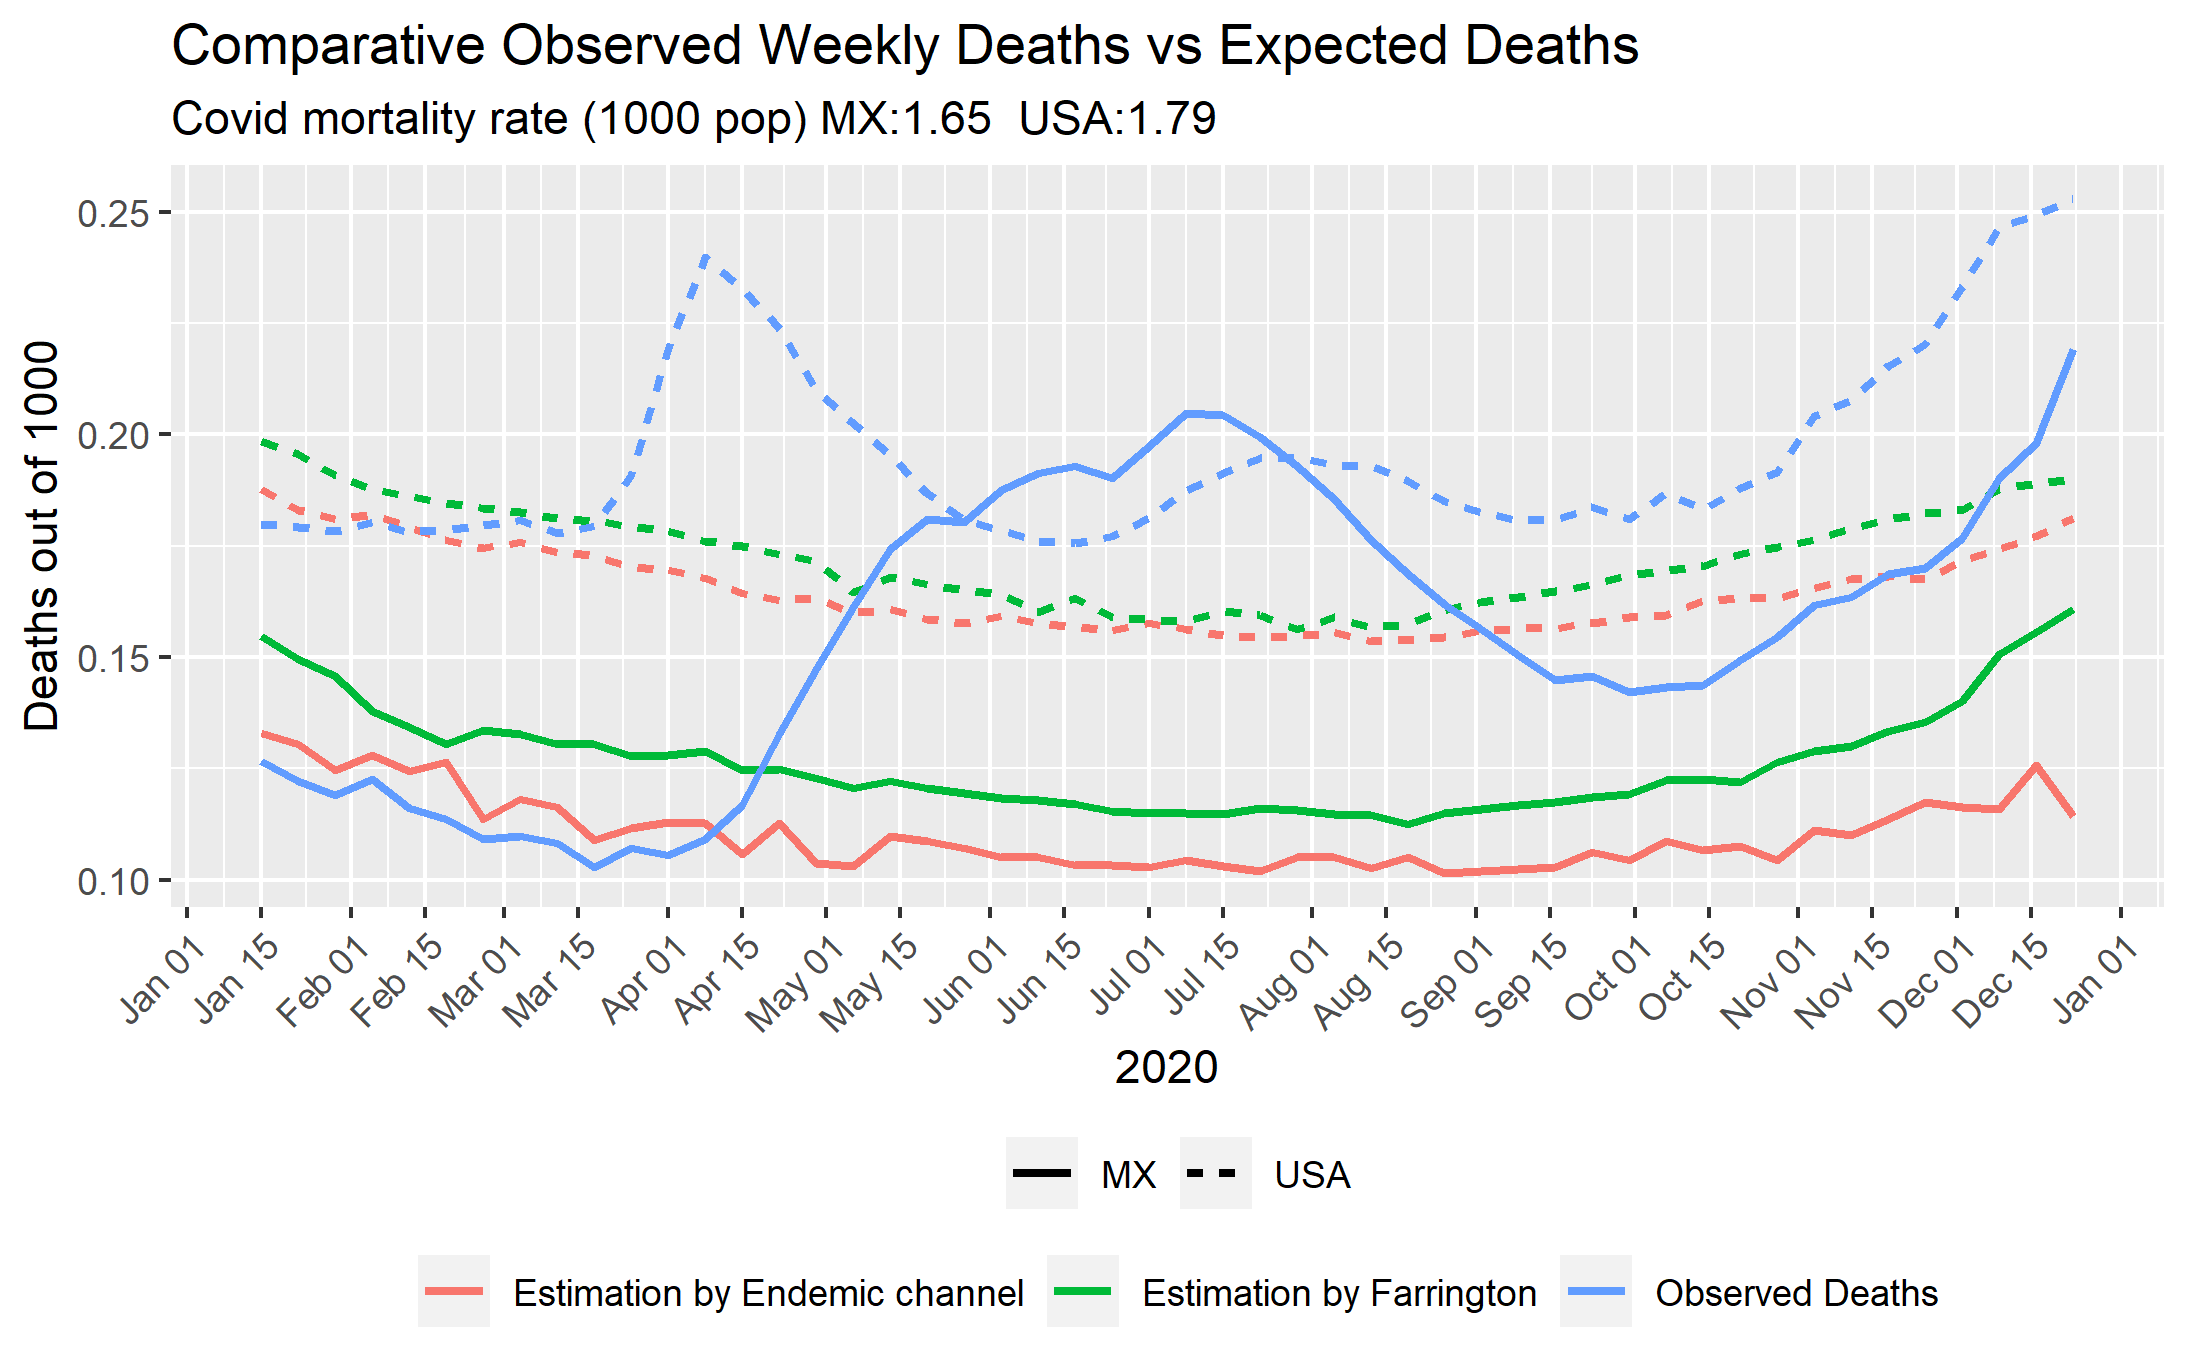
Fig. 1 presents the 2020 observed deaths count and the corresponding expected deaths for Farrington’s and the endemic channel algorithms for both countries (solid lines for Mexico, dashed lines for the U.S.). The pandemic’s effect hit the U.S. in the middle of March. In Mexico, it took until May. By the death counts, the begging of the pandemic hit harder in Mexico, but overall, for 2020, the COVID-19 mortality rate was higher for the U.S. The COVID-19 mortality rate for Mexico and the U.S. was 1.65 and 1.79 (out of 1000), respectively. Besides, the first wave extended longer in Mexico than in the U.S.
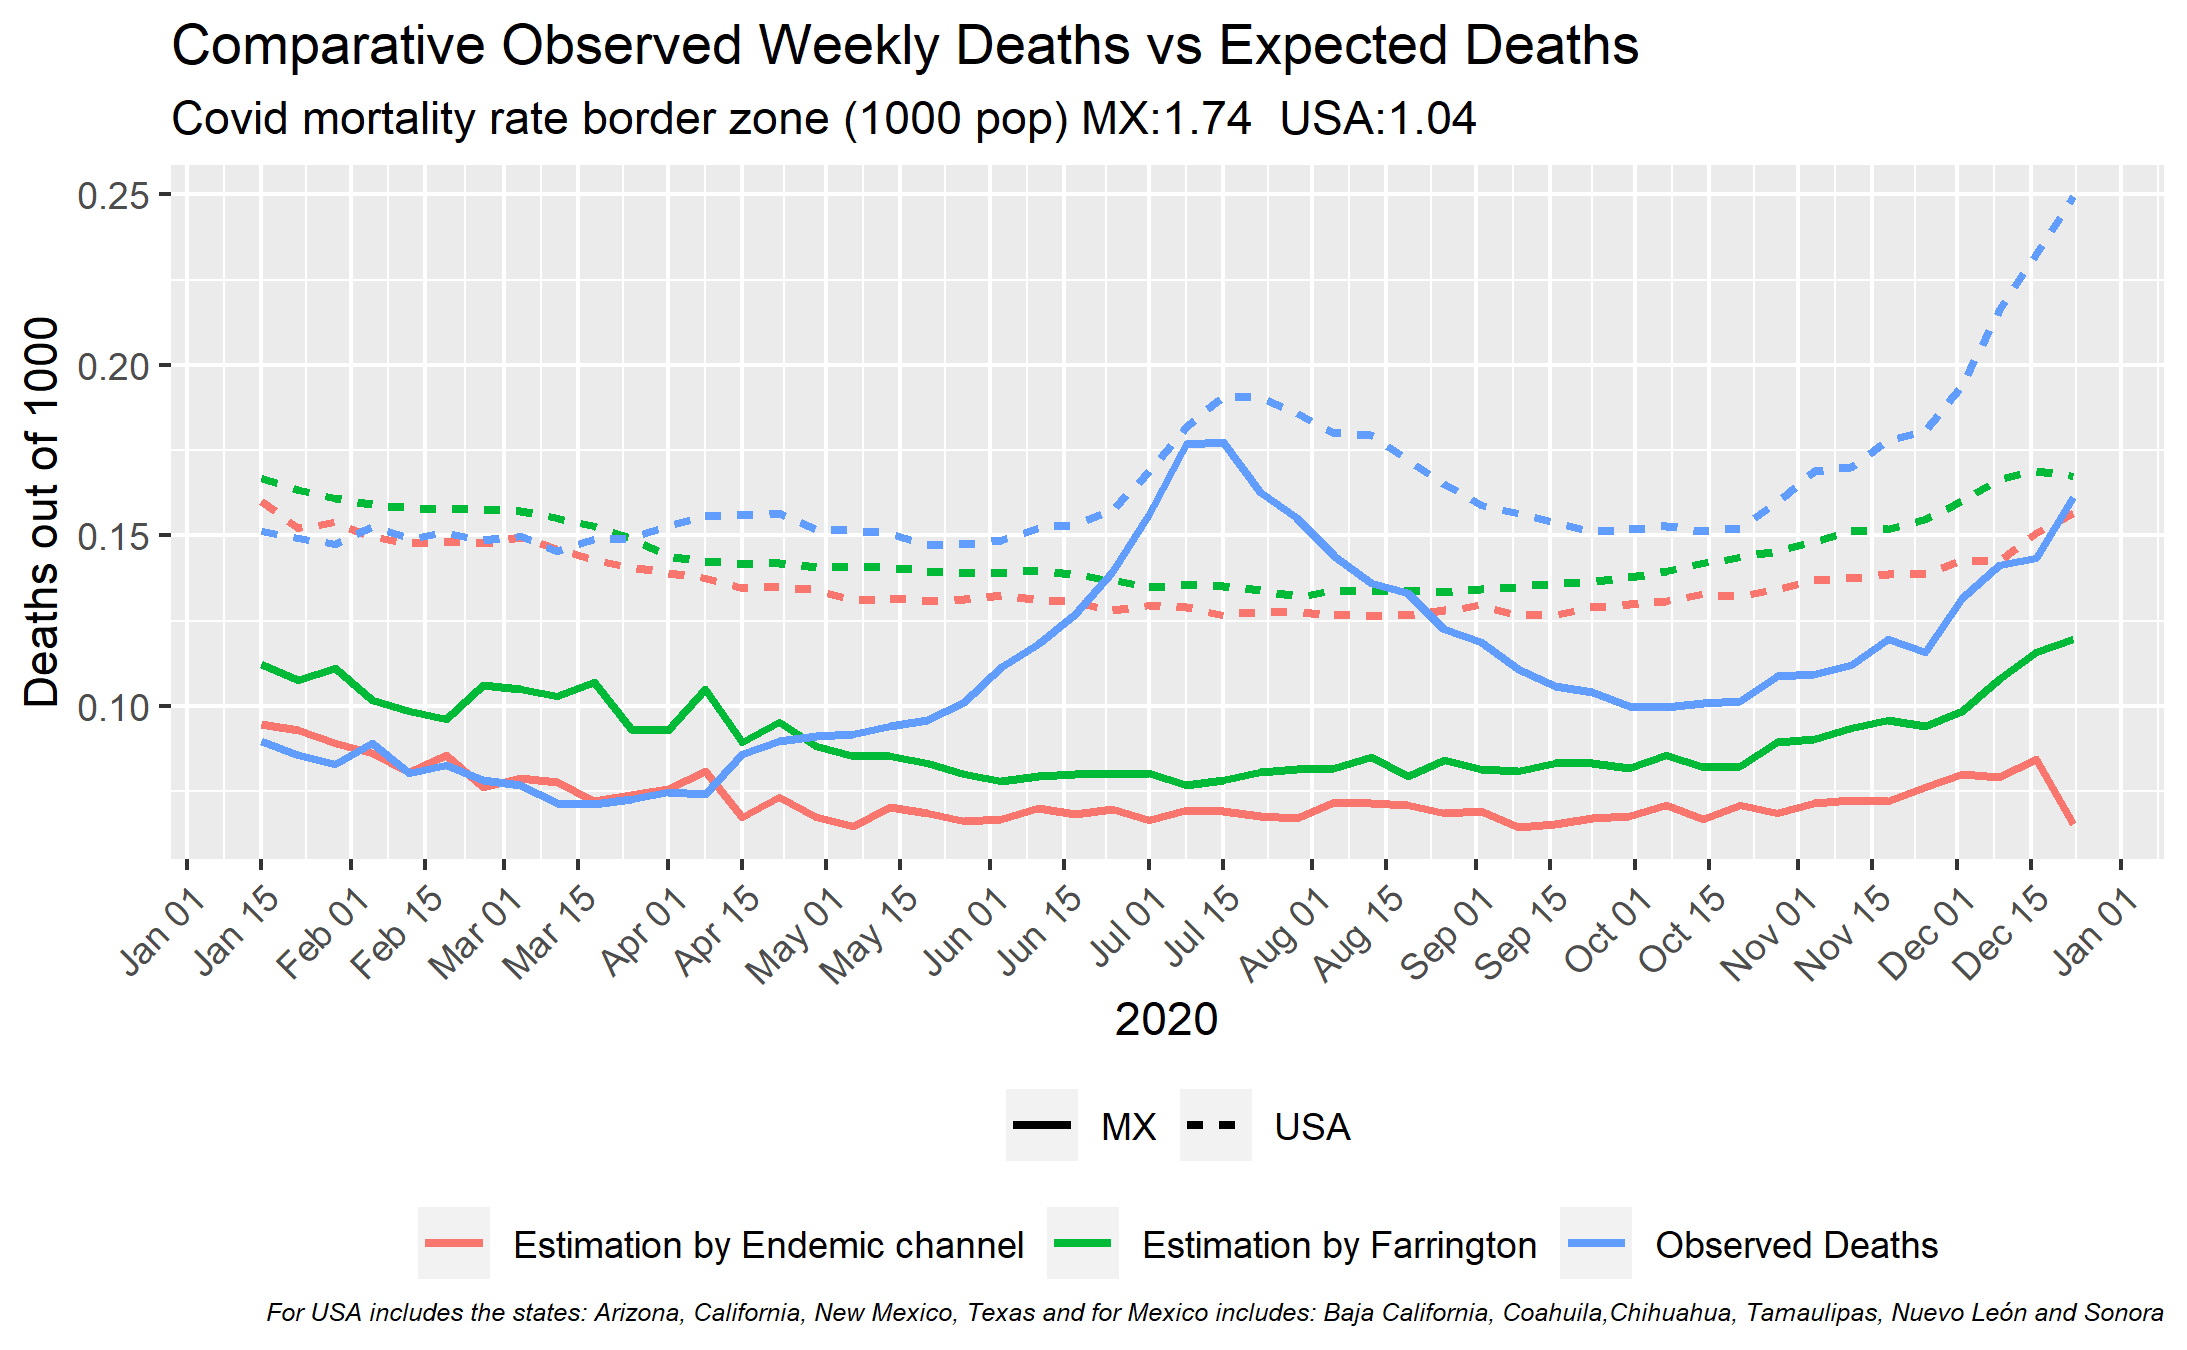
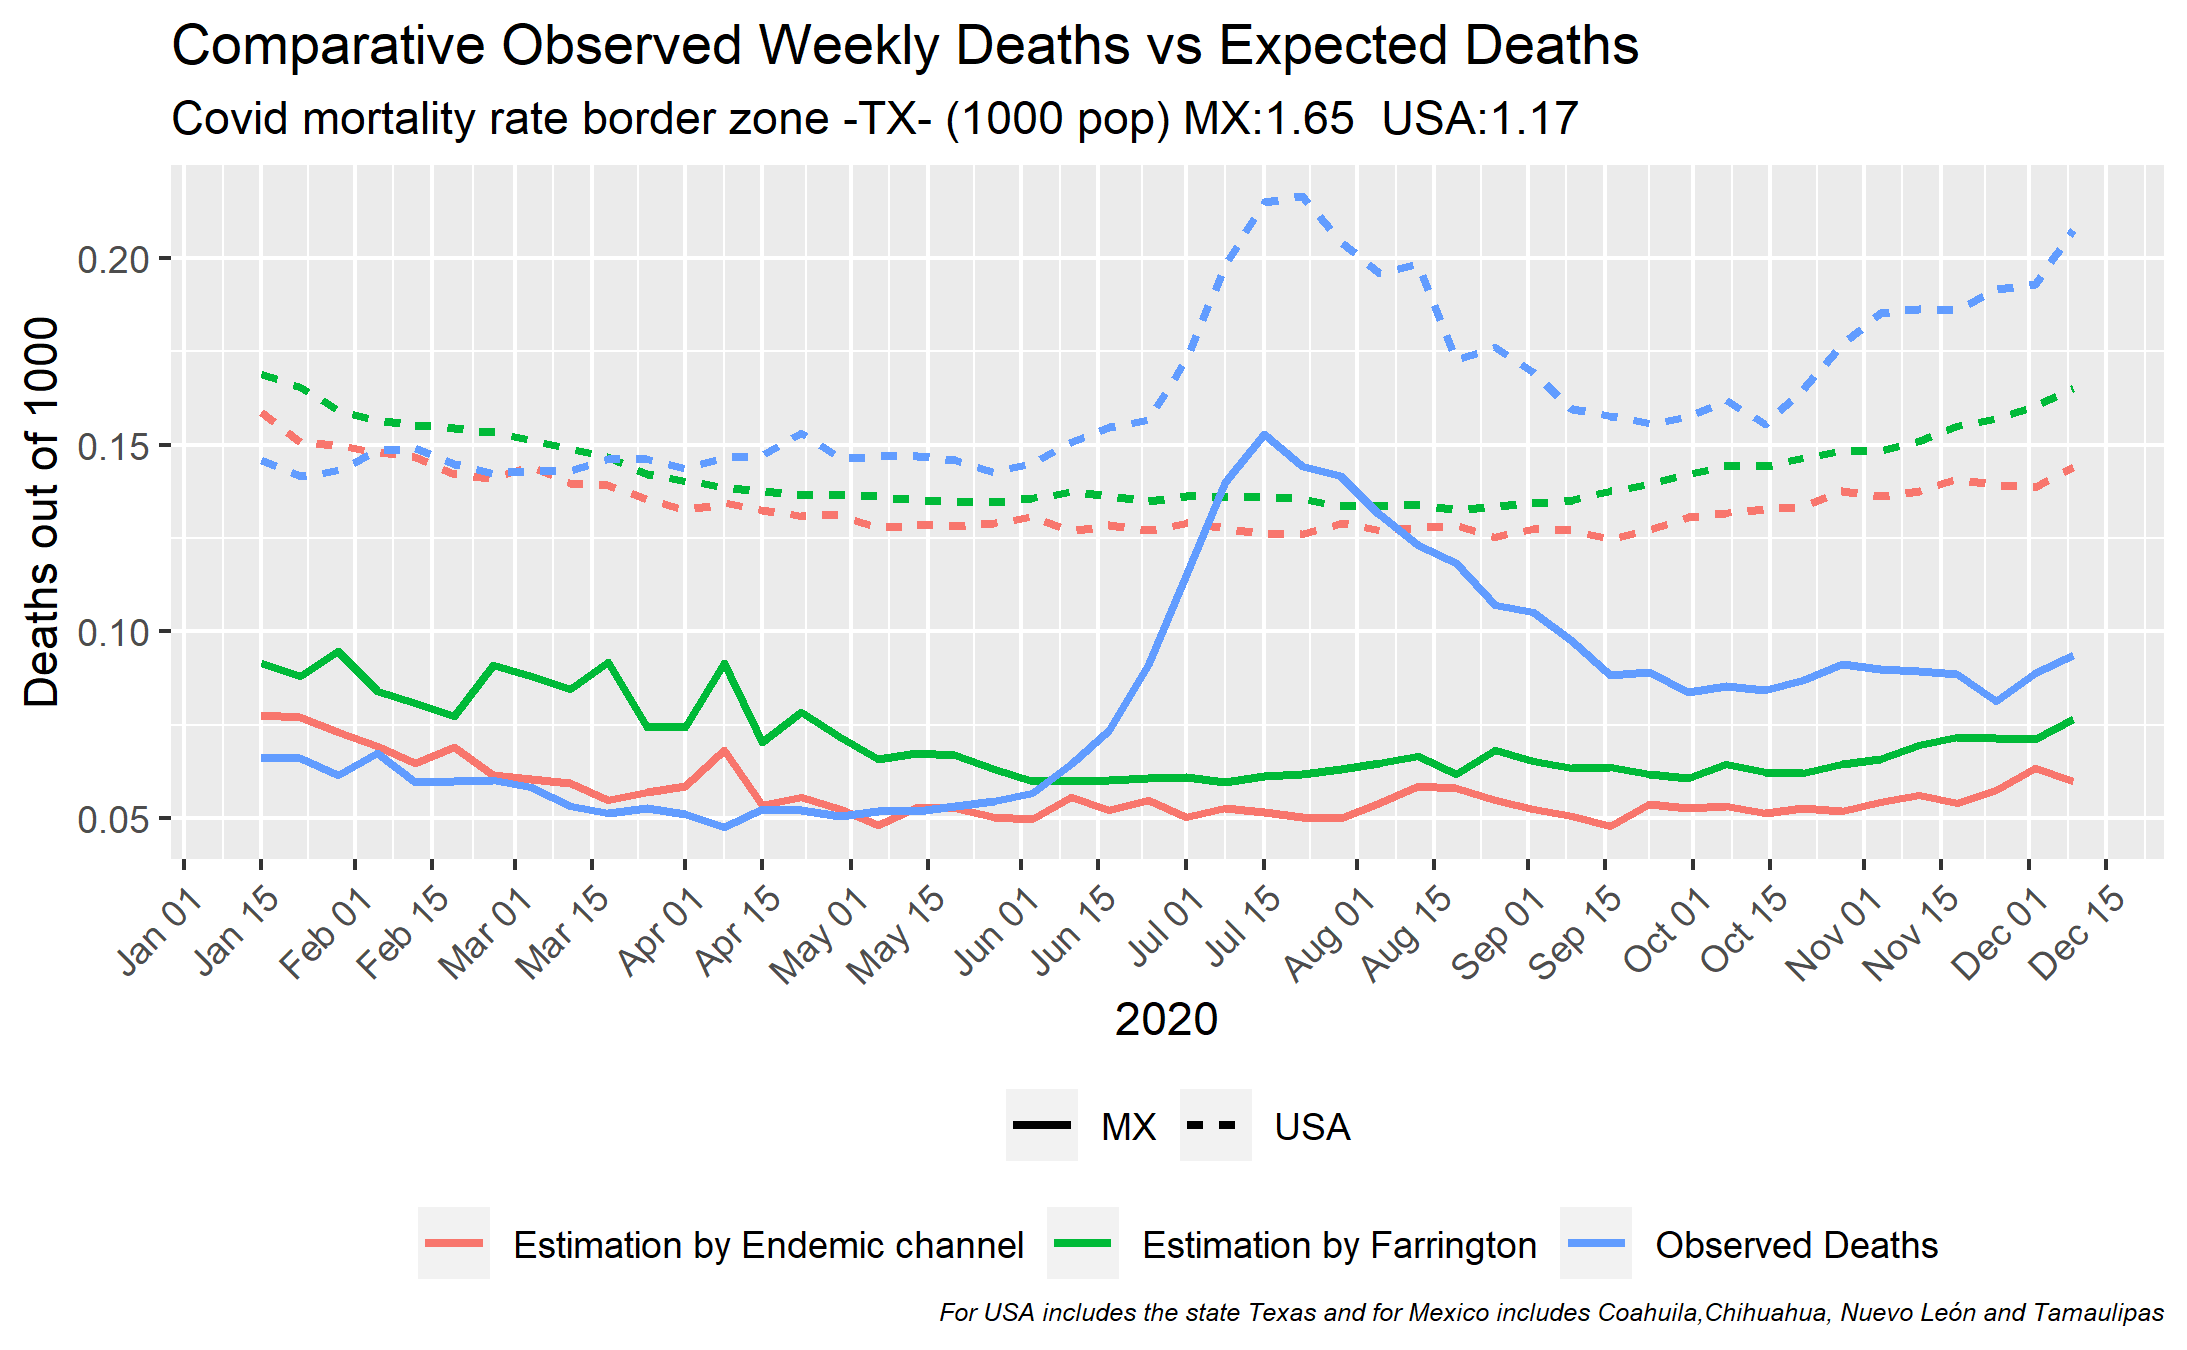
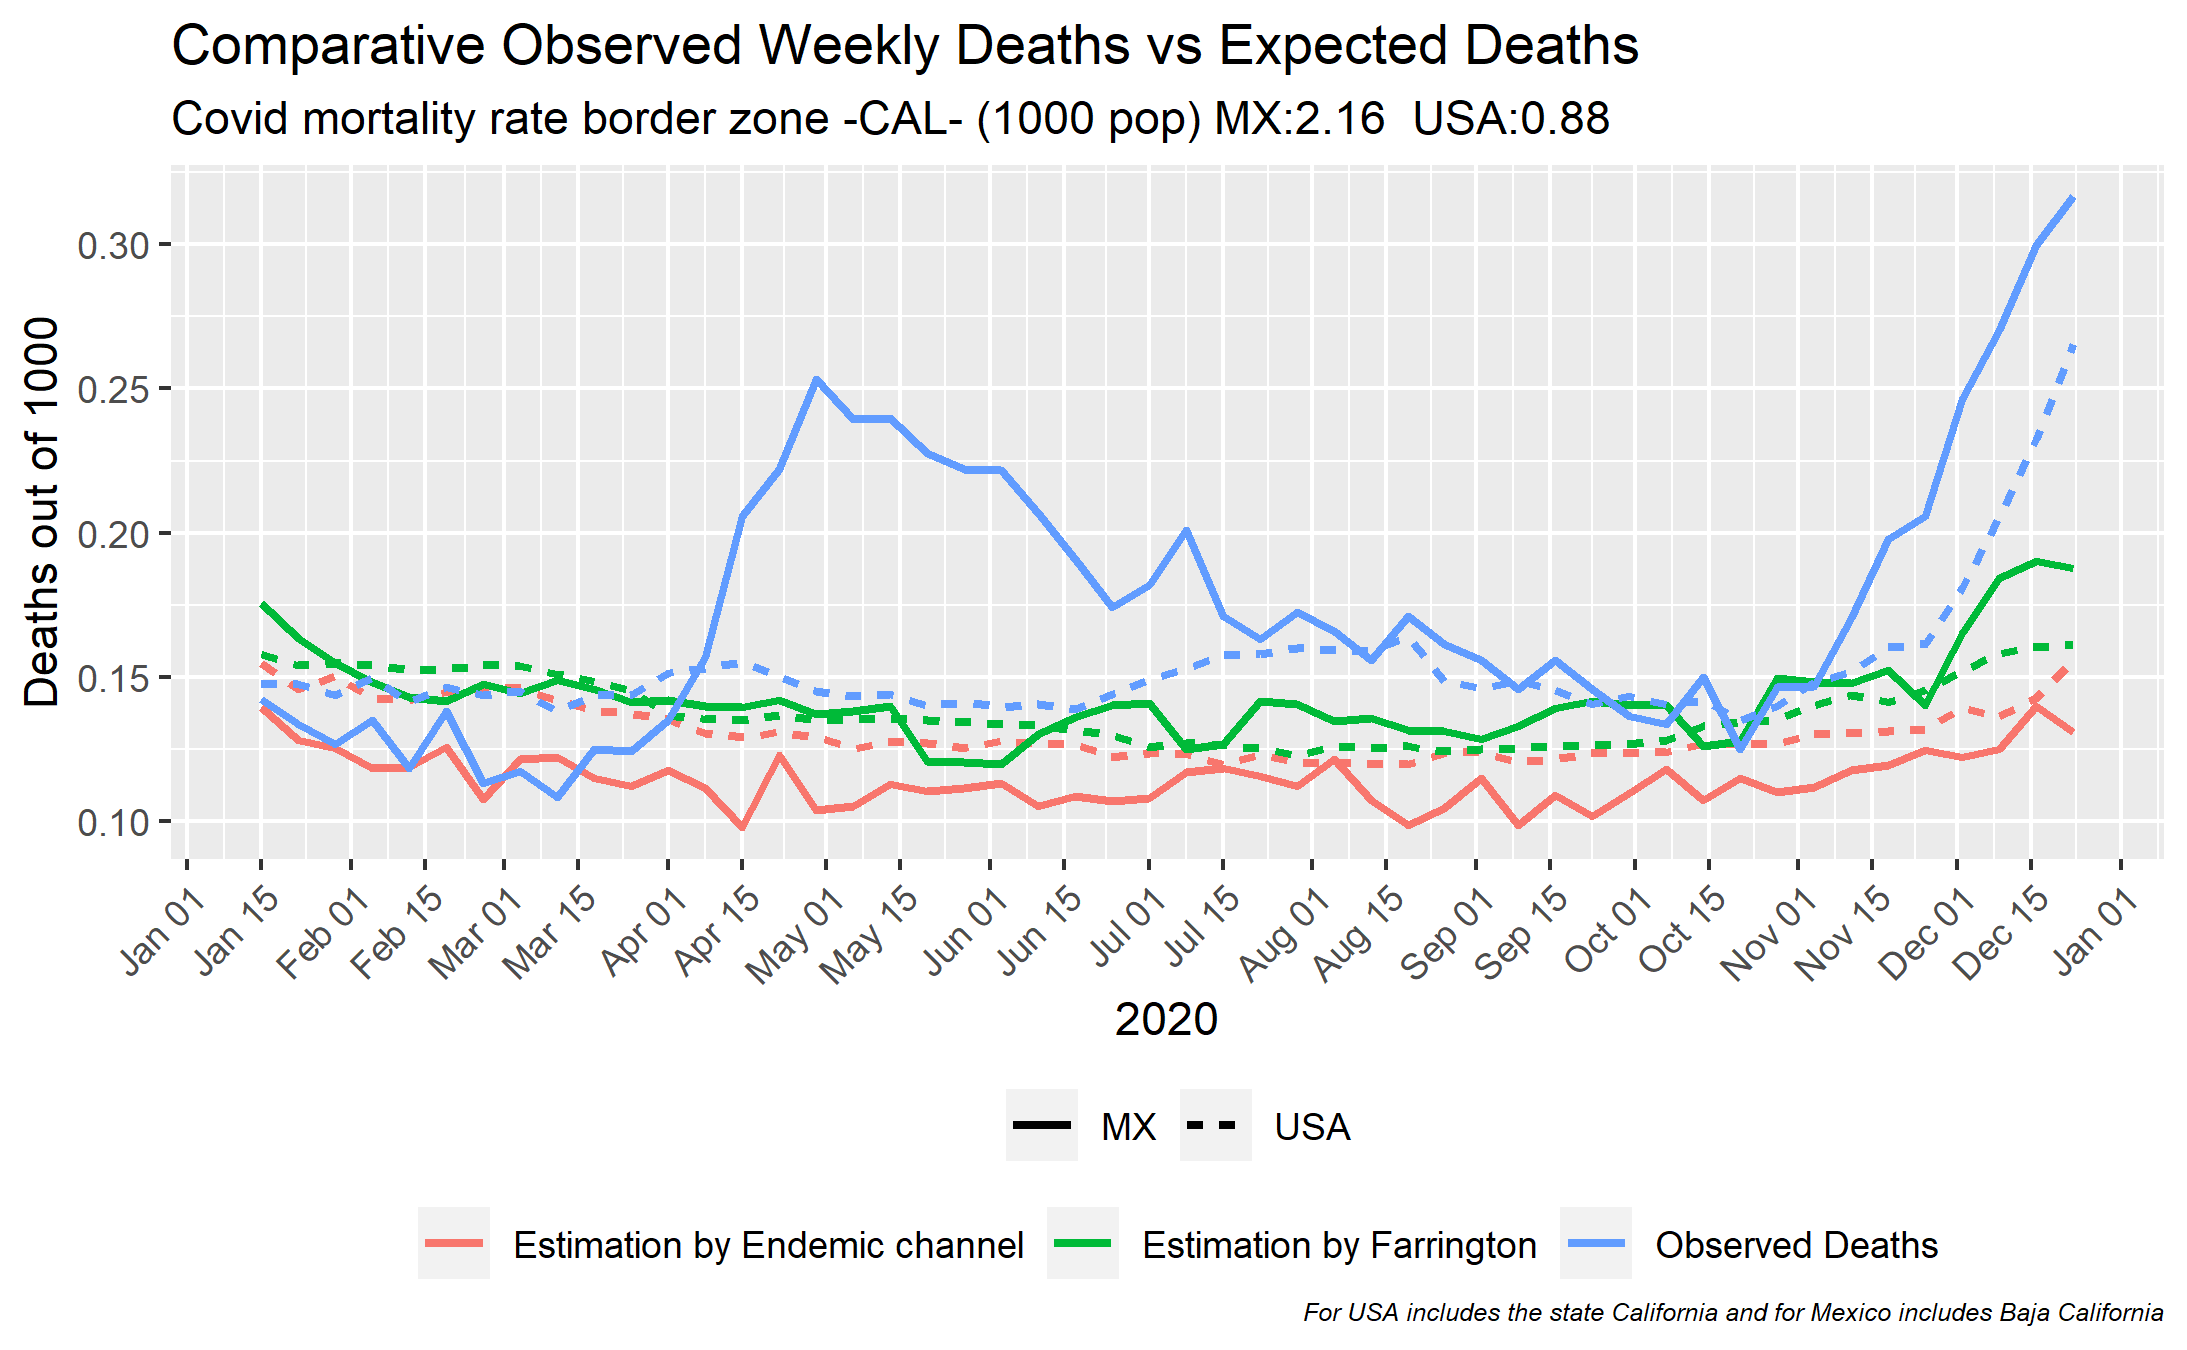
Fig. 2 shows a comparison between the mortality excess measured in the border states of Mexico and the U.S. Fig. 3 and Fig. 4 present a higher level of desegregation illustrating Texas and California’s expected and observed deaths, respectively, and the corresponding information for their neighboring Mexican states. Texas and California are inspected in more detail because they are the states that report the higher interchanges of people and goods with Mexico. Fig. 2 shows that the pandemic’s evolution seems to be the same in the border regions of both countries. In this respect, Figure Fig. 3 suggests that such similarity is caused by the interaction between Texas and its neighboring Mexican states. Fig. 4 shows evidence that the pandemic in California and Baja California has followed different evolutions.
Data:
- 2020 death counts:
- Mexico: Official database of death counts for excess mortality (Bases de Datos Para El Análisis de Exceso de Mortalidad En México, n.d.).
- USA: Weekly Provisional Counts of Deaths by State and Select Causes, 2020-2021 (Weekly Counts of Deaths by State and Select Causes, 2014-2019, n.d.).
- 2020 death counts:
- Mexico: Death counts by day and cause (Mortalidad, n.d.).
- USA: CDC’s weekly counts of deaths by state and select causes, 2014-2019 (Weekly Provisional Counts of Deaths by State and Select Causes, 2020-2021, n.d.).
Figure 1: 2020 observed vs expected deaths. Mexico vs USA. a — Binational
Figure 2: 2020 observed vs expected deaths. Border States. a — Border
Figure 3: 2020 observed vs expected deaths. Texas. a — Texas
Figure 4: 2020 observed vs expected deaths. California. a — California


